
As liquids cool (lose kinetic energy), their temperature goes down, as you might expect, but when they reach their freezing point and turn from liquids to solids, they continue to lose kinetic energy to their surrounding but their temperature starts to level off and reaches a plateau until the material becomes a solid.
How do I know that the system is still losing heat if the temperature isn't going down? The surrounding area is heating up! If you measure the surrounding area, you will see that it's temperature keeps going up even though the temperature of the liquid turning into a solid is staying the same.
Water does this in a freezer and a thermocouple probe that you snake out the door and stirrer can show it. Boston in the winter works as well. Still, students often thing that this a special property of water and not generally true of liquids. So, it would be good to have another liquid to show.
Lauric Acid is a common additive to soap and candles and is easily and cheaply found online. (eg http://www.goodearthspa.com/Lauric-Acid-99-LauricAcidBulk.htm?categoryId=-1)
Lauric acid melts/freezes at 43 C or 110 F; so, it makes a good additional example to water to show freezing curves.
Materials
(per lab group)
- 16 grams lauric acid
- Test tube (large)
- 2 thermometers (digital or analog)
- Styrofoam cup
- Ice water to fill the cup
- Holder for the cup (i.e. ring stand, larger beaker, cup filled with sand)
- Graph paper and paper for notes
- Stopwatch
- Test tube tongs/holder or hot gloves
(per room)
- hot plate
- 250 mL beakers (three or four test tubes will fit in each beaker)
- thermometer
Set Up
- Fill a large beaker with ice and water and allow to come to 0 to 5 C.
- Put 16 grams of lauric acid into each tube. I usually make a couple of extras.
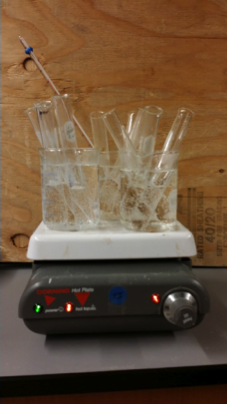
- Place test tubes into a beaker. Each will hold about four test tubes.
- Fill the beakers with water so that they are a water bath until a couple of centimeters below the rim.
- Place the beakers on a hotplate. Put a thermometer into the water. Allow the water to reach 80 C.
Procedure
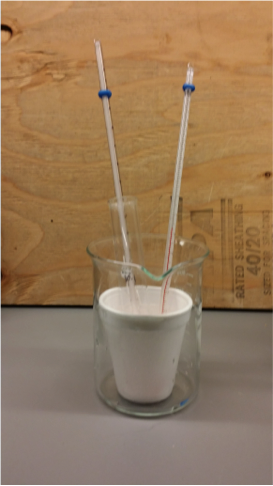
- Use a ring stand, a larger beaker, a cup partially filled with sand, or some other method to keep the Styrofoam cup from tipping over.
- Fill the Styrofoam cup with 0 to 5 C water. Do not put any ice into the water.
- Place a thermometer into the water. Record the temperature.
- Place a thermometer into the lauric acid test tube. Record the temperature.
- Make a data table with 30-second intervals to record the temperature of the lauric acid as it cools and the water as it warms.
- Place the test tube into the water. Work carefully and quickly.
- Record the temperature of both the water and the lauric acid each 30 seconds. A good plan is to divide up the work. Continue until the water reaches 30 degrees or 20 minutes has passed.
- Plot the data. (Sample data at the end)
Things to Notice
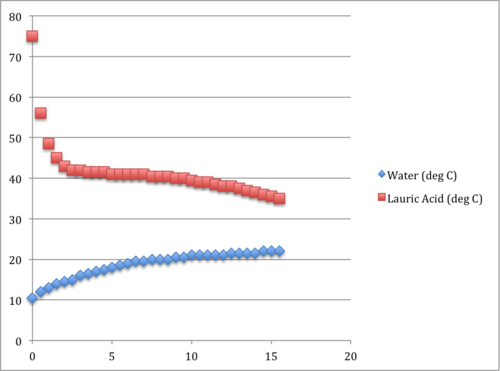
As in most phase change situations, there is a plateauing region on the graph. This is where the lauric acid is freezing – going from a liquid to a solid. While the temperature of the lauric acid is barely changing, notice that the water is still heating. Compare this heating curve to the curve after the lauric acid is a solid. Notice how the heating curve at that point is nearly flat, indicating that little thermal energy is entering the water.
